Adobe Illustrator - Vector Based Imaging.
Graphs tools gallery
Illustrator provides nine graph tools, each one for creating a different type of graph. The type of graph you choose depends on the information you want to communicate. See Create a graph.
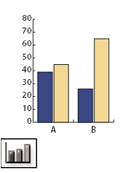
The Column Graph tool (J) creates graphs that compare values using vertical columns.
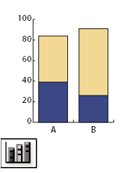
The Stacked Column Graph tool creates graphs that are similar to column graphs, but stacks the columns on top of one another, instead of side by side. This graph type is useful for showing the relationship of parts to the total.
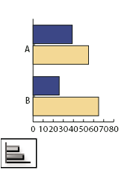
The Bar Graph tool creates graphs that are similar to column graphs, but positions the bars horizontally instead of vertically.
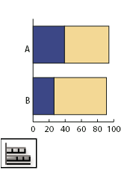
The Stacked Bar Graph tool creates graphs that are similar to stacked column graphs, but stacks the bars horizontally instead of vertically
The Line Graph tool creates graphs that use points to represent one or more sets of values, with a different line joining the points in each set. This type of graph is often used to show the trend of one or more subjects over a period of time.
The Area Graph tool creates graphs that are similar to line graphs, but emphasizes totals as well as changes in values.
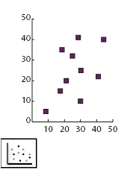
The Scatter Graph tool creates graphs that plot data points as paired sets of coordinates along the x and y axes. Scatter graphs are useful for identifying patterns or trends in data. They also can indicate whether variables affect one another.
The Pie Graph tool creates circular graphs whose wedges represent the relative percentages of the values compared.
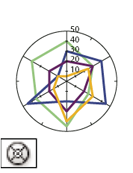
The Radar Graph tool creates graphs that compare sets of values at given points in time or in particular categories, and is displayed in a circular format. This type of graph is also called a web graph.
Drawing Graphs Moving Painting Reshaping Selection Symbols Type
.png)
| Toolbox Options | Raster / Vector | Symbols Galleries: 1 & 2 | Toolbox User Galleries (a large file) | Assessment Task | Index Page |